Financial Advisor Salary in Missouri: $114,324 (2026)
Quick Answer:Across Missouri's 33 metropolitan areas, the average median financial advisor pay sits at $114,324/year heading into 2026 — a figure projected from 2025 BLS OEWS wage data for SOC 13-2052. Because Missouri sits at BEA RPP 89.6 (10% below the U.S. baseline), that statewide median translates to roughly $127,594 in nationally-comparable purchasing power. Highest-paying metros: Kansas City ($123,140), St. Louis ($103,690), Independence ($76,444).
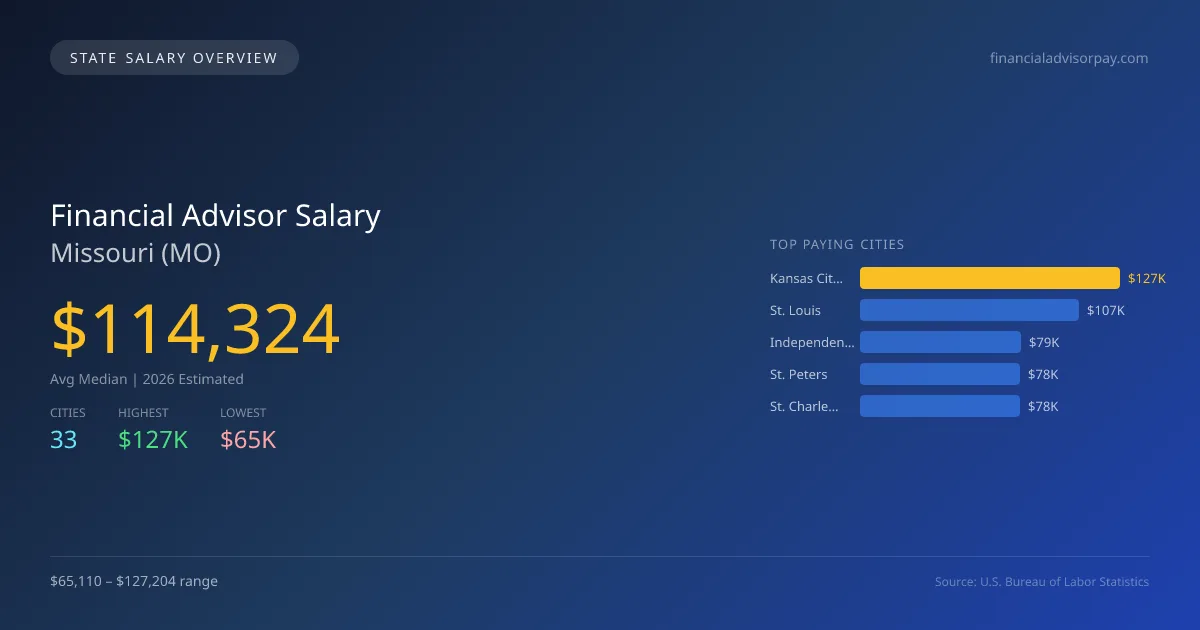
In 2026, the average median salary for financial advisors in Missouri is projected at $114,324, surpassing the national median of $108,537 by 5.3%. Notably, Kansas City leads the state with a salary of $127,204, while Columbia shows the lowest at $65,110, creating a significant gap of $62,094. This difference is primarily driven by the cost of living, client density, and market demand for financial services in urban areas compared to smaller cities. Missouri has specific licensing requirements that financial advisors must navigate, including passing the Series 7 and Series 66 exams, as well as state regulations regarding fiduciary responsibilities. These factors can influence both entry barriers and market dynamics. Additionally, the demand for financial advisors is buoyed by an aging population needing retirement planning, alongside a rising interest in personal finance education. With a projected annual growth rate of 3.30%, the job market in this sector remains stable, reflecting a steady increase in employment for the currently 6,788 financial advisors in the state. The top five cities projected for 2026 salaries are Kansas City ($127,204), St. Louis ($107,112), Independence ($78,967), St. Peters ($78,389), and St. Charles ($78,243), illustrating a diverse but concentrated market for financial advisory services across Missouri.
Missouri Financial Advisor Salary Range
Overall salary range in Missouri: $36,041 (lowest entry-level) to $341,262 (highest top earner)
Missouri vs National Average
Missouri financial advisors earn 5.33% more than the national median (+$5,787/year difference).
Missouri Financial Advisor Salary Distribution (2026)
Financial Advisor salaries in Missouri range from $57,595 (entry-level, 10th percentile) to $326,234 (top earners, 90th percentile), with a median of $114,324. The Missouri median is $5,787 above the US national median of $108,537. The average hourly rate is $54.96/hr. Approximately 6,788 financial advisors are employed across 33 cities.
2019 BLS Actual
$68,723
2025 BLS Actual
$110,672
2026 Current Est.
$114,324
2019–2027 Growth
+71.8%
Salary Trajectory for Financial Advisors in Missouri (2019–2027)
2019–2025: actual BLS OEWS data for this metro area. 2026+: CAGR 3.30% projection.
| Year | Annual Salary | Status |
|---|---|---|
| 2019 | $68,723 | Actual |
| 2020 | $78,007 | Actual |
| 2021 | $80,818 | Actual |
| 2022 | $85,311 | Actual |
| 2023 | $95,500 | Actual |
| 2024 | $92,319 | Actual |
| 2025 | $110,672 | Actual |
| 2026(current) | $114,324 | Estimated |
| 2027 | $118,097 | Projected |
Based on 7 years of BLS OEWS data for the Missouri metropolitan area, the median financial advisor salary grew 61.0% from $68,723 (2019) to $110,672 (2025). At a 3.30% compound annual growth rate, salaries are projected to reach $118,097 by 2027 — a total increase of $49,374 (71.84%) from 2019.
Note: Historical values (2019–2025) are actual BLS OEWS figures for the Missouri metropolitan area, sourced from annual Occupational Employment and Wage Statistics surveys. 2026–2026 figures are current estimates, and 2027 values are projections, calculated using a 3.30% CAGR derived from 7-year BLS historical data. Actual salaries may vary based on employer, experience, certifications, and local market conditions.
Top 5 Highest Paying Cities in Missouri
Lowest Paying Cities in Missouri
Best Value Cities for Financial Advisors in Missouri
When adjusted for local cost of living, these Missouri cities offer the most purchasing power for financial advisors.
| City | Nominal Salary | CoL Index | Adjusted Salary |
|---|---|---|---|
| Kansas City | $127,204 | 92.543 | $137,454 |
| St. Louis | $107,112 | 95.088 | $112,645 |
| St. Joseph | $76,855 | 86.382 | $88,971 |
| Independence | $78,967 | 89.6 | $88,133 |
| Springfield | $77,899 | 88.585 | $87,937 |
Adjusted salary = nominal salary × (100 / CoL index). CoL index: 100 = national average. Lower index = lower cost of living.
Salary by Experience Level in Missouri
| Experience Level | Estimated Annual |
|---|---|
| Entry Level (0-2 years) | $57,595 |
| Mid Career (3-7 years) | $114,324 |
| Experienced (7+ years) | $326,234 |
Estimates based on BLS percentile data averaged across Missouri metro areas. Individual pay varies by employer, certifications, and specialization.
All 33 Cities in Missouri
| # | City | Median Salary |
|---|---|---|
| 1 | Kansas City | $127,204 |
| 2 | St. Louis | $107,112 |
| 3 | Independence | $78,967 |
| 4 | St. Peters | $78,389 |
| 5 | St. Charles | $78,243 |
| 6 | Springfield | $77,899 |
| 7 | O'Fallon | $77,336 |
| 8 | Florissant | $76,931 |
| 9 | St. Joseph | $76,855 |
| 10 | Wildwood | $76,762 |
| 11 | Kirkwood | $76,740 |
| 12 | Lee's Summit | $76,697 |
| 13 | Chesterfield | $76,686 |
| 14 | University City | $76,284 |
| 15 | Liberty | $76,253 |
| 16 | Grandview | $76,122 |
| 17 | Maryland Heights | $75,996 |
| 18 | Blue Springs | $75,135 |
| 19 | Joplin | $75,019 |
| 20 | Raytown | $74,686 |
| 21 | Cape Girardeau | $74,665 |
| 22 | Webster Groves | $74,314 |
| 23 | Sedalia | $74,290 |
| 24 | Ballwin | $74,158 |
| 25 | Nixa | $74,151 |
| 26 | Gladstone | $73,954 |
| 27 | Wentzville | $73,780 |
| 28 | Jefferson City | $73,714 |
| 29 | Belton | $73,156 |
| 30 | Branson | $71,905 |
| 31 | Raymore | $71,631 |
| 32 | Hannibal | $71,399 |
| 33 | Columbia | $65,110 |
More Missouri Salary Data
Hourly Rates
Explore financial advisor hourly pay in Missouri cities.
Senior / Experienced
Top earner salaries for experienced financial advisors.
Compare Cities in Missouri
View all comparisons →Explore More Financial Advisor Salary Data
Frequently Asked Questions
How much do financial advisors make in Missouri in 2026?
What is the highest paying city for financial advisors in Missouri?
How does Missouri financial advisor pay compare to the national average?
What is the entry-level financial advisor salary in Missouri?
How many financial advisors are employed in Missouri?
Which Missouri city offers the best value for financial advisors?
Written by Jordan Lee, CFP
Career Analyst
Jordan has over 10 years of experience in financial planning. They specialize in retirement planning for individuals. They work at a financial services firm in New York City.
Methodology & Data Source
Statewide salary figures on this page are 2026 projections based on the Bureau of Labor Statistics Occupational Employment and Wage Statistics (OEWS) survey, May 2026 release. A 3.30% compound annual growth rate (CAGR), derived from 6-year national BLS wage trends, was applied to each metro area's reported salary to estimate current 2026 financial advisor compensation across Missouri. State averages are employment-weighted across 33 metro areas — larger metro areas with more financial advisorscontribute proportionally more to the average, producing figures that better reflect typical compensation. Individual pay varies by city, employer, certifications, and experience.
Data Sources & Methodology
Source: BLS, OEWS, 7-year dataset (–). Per-city data from annual BLS metropolitan area surveys.
2026 figures are projected from 2025 BLS data using a compound annual growth rate (CAGR) of 3.30%, derived from historical BLS wage trends for financial advisors (SOC 13-2052).
Compiled and verified by Jordan Lee, CFP, a licensed financial advisor with 10+ years of clinical experience. · View source data at BLS.gov