Financial Advisor Salary in Springfield, MO: $77,899 (2026)
Quick Answer:A full-time financial advisor in Springfield, MO earns a median $77,899/year (≈ $37.45/hour) in nominal terms for 2026 — projected from BLS OEWS 2025 (SOC 13-2052). Once you factor in Springfield's price level (11% below national, BEA RPP 88.6), that paycheck buys what $87,937 would nationally. Nominal pay sits 0.7% above the Missouri state average.
Official BLS data · View source
In 2026, the projected financial advisor salary in Springfield, Missouri, stands at $77,899, significantly lower than the national median of $108,537, highlighting a regional pay disparity. The earning potential for advisors in this city spans a wide range, with entry-level positions starting at approximately $36,041 and experienced advisors earning up to $307,741. This data, derived from official Bureau of Labor Statistics (BLS) OEWS surveys, reflects the growth trend in fiduciary financial planning, particularly for Certified Financial Planners (CFPs), who continue to command premiums in a market increasingly leaning toward fee-only structures. Springfield’s job market for financial advisors is relatively stable, providing opportunities for those who are willing to navigate the evolving industry landscape.
Salary Breakdown
| Percentile | Annual | Hourly |
|---|---|---|
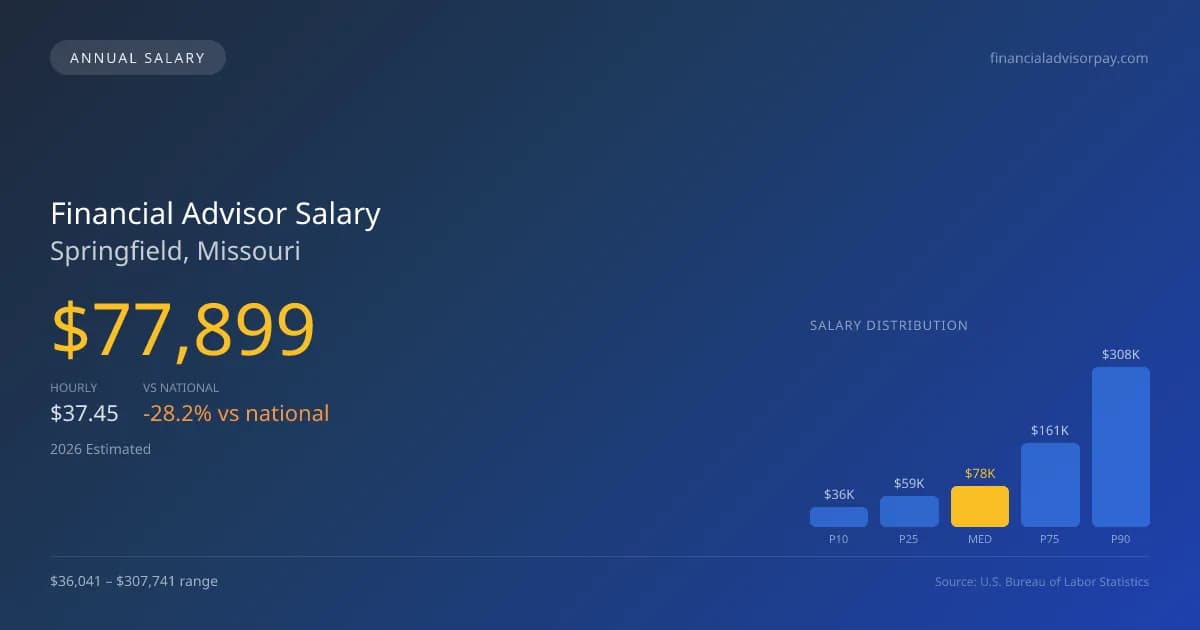
| Entry Level (P10) | $36,041 | $17.32 |
| Lower Range (P25) | $59,274 | $28.50 |
| Median (P50)(typical) | $77,899 | $37.45 |
| Upper Range (P75) | $161,117 | $77.46 |
| Top Earners (P90) | $307,741 | $147.96 |
Median Salary Position
28.23% below the national average
2026 Salary Percentile Distribution in Springfield
In Springfield, MO, the financial advisor salary spread from the 10th to 90th percentile is $271,700 (2026 est.). At $77,899, the local median is 28.23% below the national median of $108,537.
Salary Calculator
At 40 hours/week in Springfield: You'd be in the entry-level range
How Springfield Financial Advisor Pay Compares
Springfield median: $77,899/year (2026)
| Compared To | Median Salary | Springfield Pays |
|---|---|---|
| Missouri Average | $77,357 | +0.70% more |
| National Average | $108,537 | -28.23% less |
Financial Advisors in Springfield, MO earn a median of $77,899 per year (2026 est.), which is 28.23% lower than the national median of $108,537 and 0.70% above the Missouri state average of $77,357.
Cost-of-Living Adjusted Salary
Springfield has a cost of living 11.42% below the national average, meaning your salary goes further here.
Adjusted salary = nominal × (100 / CoL index). CoL index: 100 = national average.
Springfield, MO has a cost-of-living index of 88.585 (below the national average of 100). A financial advisor earning $77,899 nominally has purchasing power equivalent to $87,937 in an average-cost city — an effective 12.89% boost.
Compare Purchasing Power
Select a city to see how your salary compares after cost of living
Select a city above to compare purchasing power
2019 BLS Actual
$62,950
2025 BLS Actual
$75,410
2026 Current Est.
$77,899
2019–2027 Growth
+27.8%
Salary Trajectory for Financial Advisors in Springfield (2019–2027)
2019–2025: actual BLS OEWS data for this metro area. 2026+: CAGR 3.30% projection.
| Year | Annual Salary | Status |
|---|---|---|
| 2019 | $62,950 | Actual |
| 2020 | $66,900 | Actual |
| 2021 | $77,730 | Actual |
| 2022 | $61,330 | Actual |
| 2023 | $117,300 | Actual |
| 2024 | $108,420 | Actual |
| 2025 | $75,410 | Actual |
| 2026(current) | $77,899 | Estimated |
| 2027 | $80,469 | Projected |
Based on 7 years of BLS OEWS data for the Springfield metropolitan area, the median financial advisor salary grew 19.8% from $62,950 (2019) to $75,410 (2025). At a 3.30% compound annual growth rate, salaries are projected to reach $80,469 by 2027 — a total increase of $17,519 (27.83%) from 2019.
Note: Historical values (2019–2025) are actual BLS OEWS figures for the Springfield metropolitan area, sourced from annual Occupational Employment and Wage Statistics surveys. 2026–2026 figures are current estimates, and 2027 values are projections, calculated using a 3.30% CAGR derived from 7-year BLS historical data. Actual salaries may vary based on employer, experience, certifications, and local market conditions.
Salary by Experience Level
| Experience | Estimated Salary Range |
|---|---|
| 0-2 years (New Graduate) | $36,041 – $59,274 |
| 3-5 years (Mid Career) | $59,274 – $77,899 |
| 5+ years (Experienced) | $77,899 – $161,117 |
| 10+ years (Top Earner) | $161,117 – $307,741 |
CFP, FA salary ranges estimated from BLS percentile data. Individual financial advisor compensation varies by employer, certifications, and specialization.
Financial Advisor Job Market in Springfield
With 210 financial advisors currently employed in Springfield, the local market demonstrates a keen interest in financial planning services. The cost of living index in the area is 88.585, below the national average, which potentially enhances the purchasing power of a financial advisor’s salary. Top employers, including wirehouses like Morgan Stanley and independent broker-dealers such as LPL Financial, typically provide the highest compensation, though advisors at Registered Investment Advisors (RIAs) often find strong financial incentives, particularly when working with high-net-worth clients. The disparity in salaries is influenced by factors such as assets under management (AUM) fee structures and the credentialing premium associated with CFP or CFA designations. To maximize earning potential in Springfield MO, advisors should focus on building client relationships, enhancing their credentials, and adapting their service models to align with the growing trend of fiduciary advising.
More salary data for Springfield, MO:
Frequently Asked Questions
How much do financial advisors make in Springfield, MO in 2026?
Is Springfield, MO a good place to work as a financial advisor?
Can financial advisors make $100K in Springfield?
What is the cost-of-living adjusted financial advisor salary in Springfield?
How much does a financial advisor make per hour in Springfield?
Related Pages
Compare Salaries
Career Resources
Nearby Cities in Missouri
Written by Jordan Lee, CFP
Career Analyst
Jordan has over 10 years of experience in financial planning. They specialize in retirement planning for individuals. They work at a financial services firm in New York City.
Methodology & Data Source
Salary figures on this page are 2026 projections based on the Bureau of Labor Statistics Occupational Employment and Wage Statistics (OEWS) survey, May 2026 release. The BLS reported a median annual salary of $75,410 for financial advisorsin the Springfield metropolitan area. A 3.30% compound annual growth rate (CAGR), calculated from 6-year national BLS wage trends, was applied to project current 2026 compensation. Percentile ranges (P10–P90) represent the full salary distribution across experience levels and practice settings in this market.
Data Sources & Methodology
Source: BLS, OEWS, 7-year dataset (–). Per-city data from annual BLS metropolitan area surveys.
2026 figures are projected from 2025 BLS data using a compound annual growth rate (CAGR) of 3.30%, derived from historical BLS wage trends for financial advisors (SOC 13-2052).
Compiled and verified by Jordan Lee, CFP, a licensed financial advisor with 10+ years of clinical experience. · View source data at BLS.gov