Financial Advisor Salary in Puyallup, WA: $99,543 (2026)
Quick Answer:A full-time financial advisor in Puyallup, WA earns a median $99,543/year (≈ $47.86/hour) in nominal terms for 2026 — projected from BLS OEWS 2025 (SOC 13-2052). Once you factor in Puyallup's price level (7% above national, BEA RPP 107.4), that paycheck buys what $92,684 would nationally. Nominal pay sits 4.2% below the Washington state average.
Based on BLS state-level estimates · View source
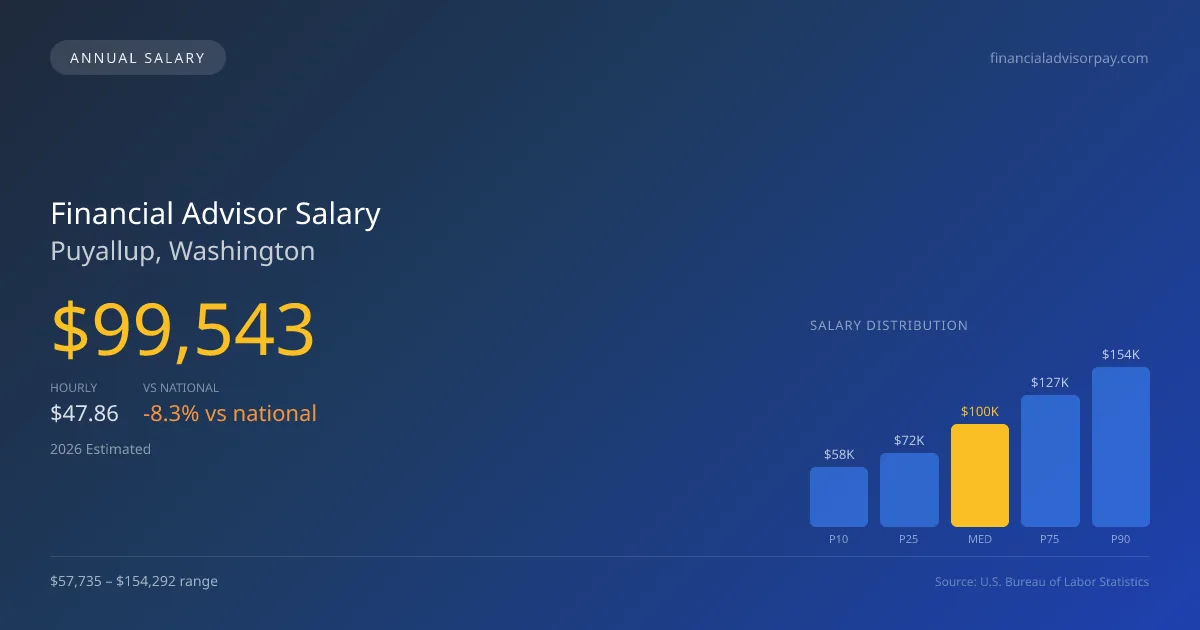
In Puyallup, Washington, financial advisors are projected to earn a median salary of $99,543 in 2026, indicating a competitive compensation level that reflects the unique structure of the industry here. Individuals in the role can expect salaries to range from $57,735 at the lower end (P10) to $154,292 at the high end (P90). These figures are derived from 2025 BLS OEWS data, adjusted for local cost factors, which are slightly higher than the national average. This market, shaped by a divide between wirehouse firms and Registered Investment Advisors (RIAs), largely operates within an assets under management (AUM) compensation model, with varying degrees of commission structures influencing pay scales. Understanding this dynamic is vital for professionals assessing their earnings potential in Puyallup’s financial advisory sector.
About the Puyallup Market
Salary estimated from Washington average ($118,000) adjusted for local cost of living.
Salary Breakdown
| Percentile | Annual | Hourly |
|---|---|---|
| Entry Level (P10) | $57,735 | $27.76 |
| Lower Range (P25) | $71,671 | $34.46 |
| Median (P50)(typical) | $99,543 | $47.86 |
| Upper Range (P75) | $127,415 | $61.26 |
| Top Earners (P90) | $154,292 | $74.18 |
Median Salary Position
8.29% below the national average
2026 Salary Percentile Distribution in Puyallup
In Puyallup, WA, the financial advisor salary spread from the 10th to 90th percentile is $96,557 (2026 est.). At $99,543, the local median is 8.29% below the national median of $108,537.
Salary Calculator
At 40 hours/week in Puyallup: You'd be in the lower-middle range
How Puyallup Financial Advisor Pay Compares
Puyallup median: $99,543/year (2026)
| Compared To | Median Salary | Puyallup Pays |
|---|---|---|
| Washington Average | $103,907 | -4.20% less |
| National Average | $108,537 | -8.29% less |
Financial Advisors in Puyallup, WA earn a median of $99,543 per year (2026 est.), which is 8.29% lower than the national median of $108,537 and 4.20% below the Washington state average of $103,907.
Cost-of-Living Adjusted Salary
Puyallup has a cost of living 7.40% above the national average.
Adjusted salary = nominal × (100 / CoL index). CoL index: 100 = national average.
Puyallup, WA has a cost-of-living index of 107.4 (above the national average of 100). While the nominal salary of $99,543 is competitive, the higher cost of living reduces purchasing power to an effective $92,684 — a 6.89% reduction.
Compare Purchasing Power
Select a city to see how your salary compares after cost of living
Select a city above to compare purchasing power
2019 BLS Actual
$80,570
2025 BLS Actual
$96,363
2026 Current Est.
$99,543
2019–2027 Growth
+27.6%
Salary Trajectory for Financial Advisors in Puyallup (2019–2027)
2019–2025: actual BLS OEWS data for this metro area. 2026+: CAGR 3.30% projection.
| Year | Annual Salary | Status |
|---|---|---|
| 2019 | $80,570 | Actual |
| 2020 | $81,927 | Actual |
| 2021 | $86,366 | Actual |
| 2022 | $87,485 | Actual |
| 2023 | $91,328 | Actual |
| 2024 | $121,352 | Actual |
| 2025 | $96,363 | Actual |
| 2026(current) | $99,543 | Estimated |
| 2027 | $102,828 | Projected |
Based on 7 years of BLS OEWS data for the Puyallup metropolitan area, the median financial advisor salary grew 19.6% from $80,570 (2019) to $96,363 (2025). At a 3.30% compound annual growth rate, salaries are projected to reach $102,828 by 2027 — a total increase of $22,258 (27.63%) from 2019.
Note: Historical values (2019–2025) are actual BLS OEWS figures for the Puyallup metropolitan area, sourced from annual Occupational Employment and Wage Statistics surveys. 2026–2026 figures are current estimates, and 2027 values are projections, calculated using a 3.30% CAGR derived from 7-year BLS historical data. Actual salaries may vary based on employer, experience, certifications, and local market conditions.
Salary by Experience Level
| Experience | Estimated Salary Range |
|---|---|
| 0-2 years (New Graduate) | $57,735 – $71,671 |
| 3-5 years (Mid Career) | $71,671 – $99,543 |
| 5+ years (Experienced) | $99,543 – $127,415 |
| 10+ years (Top Earner) | $127,415 – $154,292 |
CFP, FA salary ranges estimated from BLS percentile data. Individual financial advisor compensation varies by employer, certifications, and specialization.
Financial Advisor Job Market in Puyallup
Looking into the local job market, Puyallup currently employs only 10 financial advisors, emphasizing a niche yet potentially lucrative field. The area's cost of living index stands at 107.4, slightly above the national average, meaning that while salaries are competitive, purchasing power may be impacted. Significant employers like Morgan Stanley and Merrill Lynch typically offer higher compensation packages, particularly for advisors with substantial AUM, whereas fee-only RIAs can provide lucrative opportunities tied to fiduciary values and a fee model that benefits high-net-worth clients. The wide salary variance results from factors such as client concentration and the presence of CFP or CFA credentials, which can command higher pay. For advisors looking to maximize their financial advisor pay in Puyallup, aligning with RIA firms, ensuring high asset management, and obtaining prestigious certifications would be prudent strategies.
More salary data for Puyallup, WA:
Frequently Asked Questions
How much do financial advisors make in Puyallup, WA in 2026?
Is Puyallup, WA a good place to work as a financial advisor?
Can financial advisors make $100K in Puyallup?
What is the cost-of-living adjusted financial advisor salary in Puyallup?
How much does a financial advisor make per hour in Puyallup?
Related Pages
Compare Salaries
Career Resources
Nearby Cities in Washington
Written by Jordan Lee, CFP
Career Analyst
Jordan has over 10 years of experience in financial planning. They specialize in retirement planning for individuals. They work at a financial services firm in New York City.
Methodology & Data Source
Salary figures on this page are 2026 projections based on the Bureau of Labor Statistics Occupational Employment and Wage Statistics (OEWS) survey, May 2026 release. The BLS reported a median annual salary of $96,363 for financial advisorsin the Puyallup metropolitan area. A 3.30% compound annual growth rate (CAGR), calculated from 6-year national BLS wage trends, was applied to project current 2026 compensation. Percentile ranges (P10–P90) represent the full salary distribution across experience levels and practice settings in this market.
Data Sources & Methodology
Salary data for Puyallup is estimated from official BLS state-level occupational wage data (2025), adjusted for regional cost-of-living differences using BEA RPP (Regional Price Parities).
2026 figures are projected from 2025 BLS data using a compound annual growth rate (CAGR) of 3.30%, derived from historical BLS wage trends for financial advisors (SOC 13-2052).
Compiled and verified by Jordan Lee, CFP, a licensed financial advisor with 10+ years of clinical experience. · View source data at BLS.gov