Financial Advisor Salary in Rutland, VT: $104,105 (2026)
Quick Answer:A full-time financial advisor in Rutland, VT earns a median $104,105/year (≈ $50.05/hour) in nominal terms for 2026 — projected from BLS OEWS 2025 (SOC 13-2052). Once you factor in Rutland's price level (4% above national, BEA RPP 103.5), that paycheck buys what $100,585 would nationally. Nominal pay sits 7.3% below the Vermont state average.
Based on BLS state-level estimates · View source
In 2026, the financial advisor salary in Rutland, VT, is projected to reach a median of $104,105, slightly below the national average of $108,537. The salary range for financial advisors in this area runs from $60,381 at the 10th percentile to a high of $161,362 at the 90th percentile. These figures are derived from 2025 BLS state-level data and adjusted for the regional cost of living, which reflects an index of 103.5. While Rutland's job market only has four financial advisors, the competitive landscape creates opportunities for skilled individuals, especially those transitioning from wirehouse positions to independent roles, where compensation can significantly increase over time due to more favorable fee structures and client growth.
About the Rutland Market
Salary estimated from Vermont average ($92,000) adjusted for local cost of living.
Salary Breakdown
| Percentile | Annual | Hourly |
|---|---|---|
| Entry Level (P10) | $60,381 | $29.03 |
| Lower Range (P25) | $74,956 | $36.04 |
| Median (P50)(typical) | $104,105 | $50.05 |
| Upper Range (P75) | $133,254 | $64.07 |
| Top Earners (P90) | $161,362 | $77.58 |
Median Salary Position
4.08% below the national average
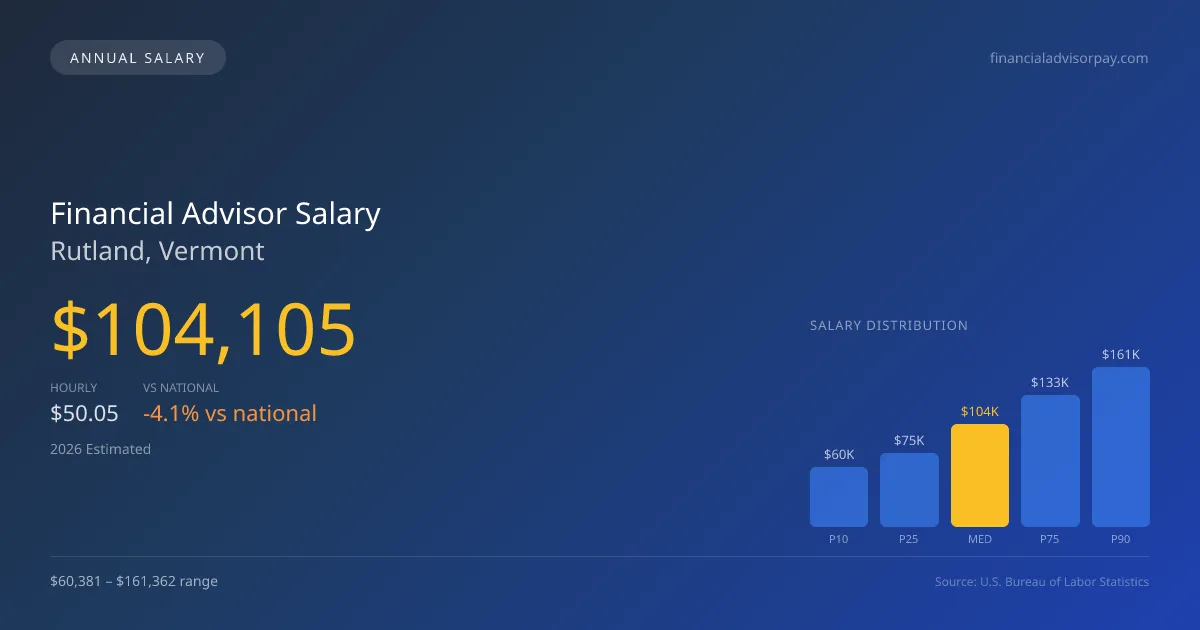
2026 Salary Percentile Distribution in Rutland
In Rutland, VT, the financial advisor salary spread from the 10th to 90th percentile is $100,981 (2026 est.). At $104,105, the local median is 4.08% below the national median of $108,537.
Salary Calculator
At 40 hours/week in Rutland: You'd be in the lower-middle range
How Rutland Financial Advisor Pay Compares
Rutland median: $104,105/year (2026)
| Compared To | Median Salary | Rutland Pays |
|---|---|---|
| Vermont Average | $112,303 | -7.30% less |
| National Average | $108,537 | -4.08% less |
Financial Advisors in Rutland, VT earn a median of $104,105 per year (2026 est.), which is 4.08% lower than the national median of $108,537 and 7.30% below the Vermont state average of $112,303.
Cost-of-Living Adjusted Salary
Rutland has a cost of living 3.50% above the national average.
Adjusted salary = nominal × (100 / CoL index). CoL index: 100 = national average.
Rutland, VT has a cost-of-living index of 103.5 (above the national average of 100). While the nominal salary of $104,105 is competitive, the higher cost of living reduces purchasing power to an effective $100,585 — a 3.38% reduction.
Compare Purchasing Power
Select a city to see how your salary compares after cost of living
Select a city above to compare purchasing power
2019 BLS Actual
$84,262
2025 BLS Actual
$100,779
2026 Current Est.
$104,105
2019–2027 Growth
+27.6%
Salary Trajectory for Financial Advisors in Rutland (2019–2027)
2019–2025: actual BLS OEWS data for this metro area. 2026+: CAGR 3.30% projection.
| Year | Annual Salary | Status |
|---|---|---|
| 2019 | $84,262 | Actual |
| 2020 | $85,682 | Actual |
| 2021 | $90,324 | Actual |
| 2022 | $91,494 | Actual |
| 2023 | $95,513 | Actual |
| 2024 | $88,243 | Actual |
| 2025 | $100,779 | Actual |
| 2026(current) | $104,105 | Estimated |
| 2027 | $107,540 | Projected |
Based on 7 years of BLS OEWS data for the Rutland metropolitan area, the median financial advisor salary grew 19.6% from $84,262 (2019) to $100,779 (2025). At a 3.30% compound annual growth rate, salaries are projected to reach $107,540 by 2027 — a total increase of $23,278 (27.63%) from 2019.
Note: Historical values (2019–2025) are actual BLS OEWS figures for the Rutland metropolitan area, sourced from annual Occupational Employment and Wage Statistics surveys. 2026–2026 figures are current estimates, and 2027 values are projections, calculated using a 3.30% CAGR derived from 7-year BLS historical data. Actual salaries may vary based on employer, experience, certifications, and local market conditions.
Salary by Experience Level
| Experience | Estimated Salary Range |
|---|---|
| 0-2 years (New Graduate) | $60,381 – $74,956 |
| 3-5 years (Mid Career) | $74,956 – $104,105 |
| 5+ years (Experienced) | $104,105 – $133,254 |
| 10+ years (Top Earner) | $133,254 – $161,362 |
CFP, FA salary ranges estimated from BLS percentile data. Individual financial advisor compensation varies by employer, certifications, and specialization.
Financial Advisor Job Market in Rutland
Understanding the local dynamics of financial advisor pay in Rutland, VT, reveals various factors influencing compensation levels. The cost of living in Rutland, while slightly above the national average, means that take-home pay may not stretch as far as in lower-cost areas. Among local employers, independent broker-dealers like LPL Financial and full-service firms such as Morgan Stanley or UBS are likely to provide the highest pay. However, those with a strong book of business and a strategic focus on high-net-worth (HNW) clients can enhance their earnings considerably, especially if they are engaged in a fee-only fiduciary model typical of registered investment advisors (RIAs). By maintaining CFP or CFA credentials, financial advisors can distinguish themselves and potentially command higher fees, optimizing their earnings within Rutland's small but strategically positioned financial services market.
More salary data for Rutland, VT:
Frequently Asked Questions
How much do financial advisors make in Rutland, VT in 2026?
Is Rutland, VT a good place to work as a financial advisor?
Can financial advisors make $100K in Rutland?
What is the cost-of-living adjusted financial advisor salary in Rutland?
How much does a financial advisor make per hour in Rutland?
Related Pages
Compare Salaries
Career Resources
Nearby Cities in Vermont
Written by Jordan Lee, CFP
Career Analyst
Jordan has over 10 years of experience in financial planning. They specialize in retirement planning for individuals. They work at a financial services firm in New York City.
Methodology & Data Source
Salary figures on this page are 2026 projections based on the Bureau of Labor Statistics Occupational Employment and Wage Statistics (OEWS) survey, May 2026 release. The BLS reported a median annual salary of $100,779 for financial advisorsin the Rutland metropolitan area. A 3.30% compound annual growth rate (CAGR), calculated from 6-year national BLS wage trends, was applied to project current 2026 compensation. Percentile ranges (P10–P90) represent the full salary distribution across experience levels and practice settings in this market.
Data Sources & Methodology
Salary data for Rutland is estimated from official BLS state-level occupational wage data (2025), adjusted for regional cost-of-living differences using BEA RPP (Regional Price Parities).
2026 figures are projected from 2025 BLS data using a compound annual growth rate (CAGR) of 3.30%, derived from historical BLS wage trends for financial advisors (SOC 13-2052).
Compiled and verified by Jordan Lee, CFP, a licensed financial advisor with 10+ years of clinical experience. · View source data at BLS.gov