Financial Advisor Salary in San Angelo, TX: $49,966 (2026)
Quick Answer:A full-time financial advisor in San Angelo, TX earns a median $49,966/year (≈ $24.03/hour) in nominal terms for 2026 — projected from BLS OEWS 2025 (SOC 13-2052). Once you factor in San Angelo's price level (8% below national, BEA RPP 92.5), that paycheck buys what $54,045 would nationally. Nominal pay sits 42.4% below the Texas state average.
Official BLS data · View source
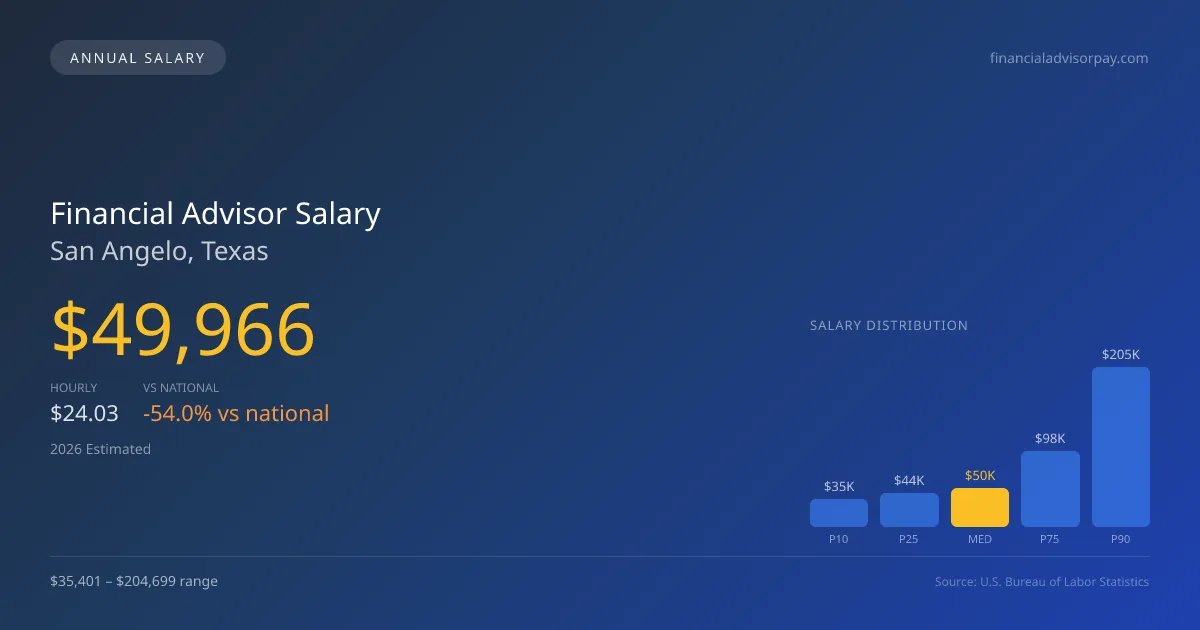
Financial advisors in San Angelo, Texas, are projected to earn a median annual salary of $49,966 in 2026, reflecting a significant gap when compared to the national median of $108,537. The salary range for financial advisors in the region goes from $35,401 at the 10th percentile to as high as $204,699 at the 90th percentile, highlighting the potential for substantial variation in earnings. These numbers, derived from 2025 BLS OEWS data and projected to 2026, indicate an increasing trend towards fee-only fiduciary models, which are expected to gain traction among advisors in San Angelo. As the local market evolves, those with the CFP credential may command a premium, particularly as the financial planning profession bifurcates between commission-based and fee-only structures.
Salary Breakdown
| Percentile | Annual | Hourly |
|---|---|---|
| Entry Level (P10) | $35,401 | $17.02 |
| Lower Range (P25) | $44,130 | $21.22 |
| Median (P50)(typical) | $49,966 | $24.03 |
| Upper Range (P75) | $97,732 | $46.99 |
| Top Earners (P90) | $204,699 | $98.41 |
Median Salary Position
53.96% below the national average
2026 Salary Percentile Distribution in San Angelo
In San Angelo, TX, the financial advisor salary spread from the 10th to 90th percentile is $169,298 (2026 est.). At $49,966, the local median is 53.96% below the national median of $108,537.
Salary Calculator
At 40 hours/week in San Angelo: You'd be in the entry-level range
How San Angelo Financial Advisor Pay Compares
San Angelo median: $49,966/year (2026)
| Compared To | Median Salary | San Angelo Pays |
|---|---|---|
| Texas Average | $86,747 | -42.40% less |
| National Average | $108,537 | -53.96% less |
Financial Advisors in San Angelo, TX earn a median of $49,966 per year (2026 est.), which is 53.96% lower than the national median of $108,537 and 42.40% below the Texas state average of $86,747.
Cost-of-Living Adjusted Salary
San Angelo has a cost of living 7.55% below the national average, meaning your salary goes further here.
Adjusted salary = nominal × (100 / CoL index). CoL index: 100 = national average.
San Angelo, TX has a cost-of-living index of 92.453 (below the national average of 100). A financial advisor earning $49,966 nominally has purchasing power equivalent to $54,045 in an average-cost city — an effective 8.16% boost.
Compare Purchasing Power
Select a city to see how your salary compares after cost of living
Select a city above to compare purchasing power
2019 BLS Actual
$40,443
2025 BLS Actual
$48,370
2026 Current Est.
$49,966
2019–2027 Growth
+27.6%
Salary Trajectory for Financial Advisors in San Angelo (2019–2027)
2019–2025: actual BLS OEWS data for this metro area. 2026+: CAGR 3.30% projection.
| Year | Annual Salary | Status |
|---|---|---|
| 2019 | $40,443 | Actual |
| 2020 | $41,124 | Actual |
| 2021 | $49,900 | Actual |
| 2022 | $48,080 | Actual |
| 2023 | $55,920 | Actual |
| 2024 | $60,250 | Actual |
| 2025 | $48,370 | Actual |
| 2026(current) | $49,966 | Estimated |
| 2027 | $51,615 | Projected |
Based on 7 years of BLS OEWS data for the San Angelo metropolitan area, the median financial advisor salary grew 19.6% from $40,443 (2019) to $48,370 (2025). At a 3.30% compound annual growth rate, salaries are projected to reach $51,615 by 2027 — a total increase of $11,172 (27.62%) from 2019.
Note: Historical values (2019–2025) are actual BLS OEWS figures for the San Angelo metropolitan area, sourced from annual Occupational Employment and Wage Statistics surveys. 2026–2026 figures are current estimates, and 2027 values are projections, calculated using a 3.30% CAGR derived from 7-year BLS historical data. Actual salaries may vary based on employer, experience, certifications, and local market conditions.
Salary by Experience Level
| Experience | Estimated Salary Range |
|---|---|
| 0-2 years (New Graduate) | $35,401 – $44,130 |
| 3-5 years (Mid Career) | $44,130 – $49,966 |
| 5+ years (Experienced) | $49,966 – $97,732 |
| 10+ years (Top Earner) | $97,732 – $204,699 |
CFP, FA salary ranges estimated from BLS percentile data. Individual financial advisor compensation varies by employer, certifications, and specialization.
Financial Advisor Job Market in San Angelo
A closer look at the San Angelo job market reveals that there are currently 30 financial advisors employed in the area, presenting a competitive landscape for both prospective and current professionals. With a cost-of-living index of 92.453, residents experience relatively lower expenses, which can enhance the purchasing power of the median advisor salary. Among local employers, wirehouses like Morgan Stanley and UBS tend to offer the highest compensation packages, but independent broker-dealers and RIAs are increasingly popular due to their fee-based models and potential for higher client retention. The disparity in pay is often driven by factors such as assets under management, client concentration, and credentialing, with CFP and CFA certifications providing distinct advantages. For those aiming to maximize their financial advisor pay in San Angelo, focusing on building a robust client base while enhancing skills through continuing education can be pivotal in capturing higher fee structures typical of RIAs.
More salary data for San Angelo, TX:
Frequently Asked Questions
How much do financial advisors make in San Angelo, TX in 2026?
Is San Angelo, TX a good place to work as a financial advisor?
Can financial advisors make $100K in San Angelo?
What is the cost-of-living adjusted financial advisor salary in San Angelo?
How much does a financial advisor make per hour in San Angelo?
Related Pages
Compare Salaries
Career Resources
Nearby Cities in Texas
Written by Jordan Lee, CFP
Career Analyst
Jordan has over 10 years of experience in financial planning. They specialize in retirement planning for individuals. They work at a financial services firm in New York City.
Methodology & Data Source
Salary figures on this page are 2026 projections based on the Bureau of Labor Statistics Occupational Employment and Wage Statistics (OEWS) survey, May 2026 release. The BLS reported a median annual salary of $48,370 for financial advisorsin the San Angelo metropolitan area. A 3.30% compound annual growth rate (CAGR), calculated from 6-year national BLS wage trends, was applied to project current 2026 compensation. Percentile ranges (P10–P90) represent the full salary distribution across experience levels and practice settings in this market.
Data Sources & Methodology
Source: BLS, OEWS, 5-year dataset (–). Per-city data from annual BLS metropolitan area surveys.
2026 figures are projected from 2025 BLS data using a compound annual growth rate (CAGR) of 3.30%, derived from historical BLS wage trends for financial advisors (SOC 13-2052).
Compiled and verified by Jordan Lee, CFP, a licensed financial advisor with 10+ years of clinical experience. · View source data at BLS.gov