Financial Advisor Salary in Rochester, NY: $104,488 (2026)
Quick Answer:A full-time financial advisor in Rochester, NY earns a median $104,488/year (≈ $50.23/hour) in nominal terms for 2026 — projected from BLS OEWS 2025 (SOC 13-2052). Once you factor in Rochester's price level (3% below national, BEA RPP 97.0), that paycheck buys what $107,681 would nationally. Nominal pay sits 18.0% below the New York state average.
Official BLS data · View source
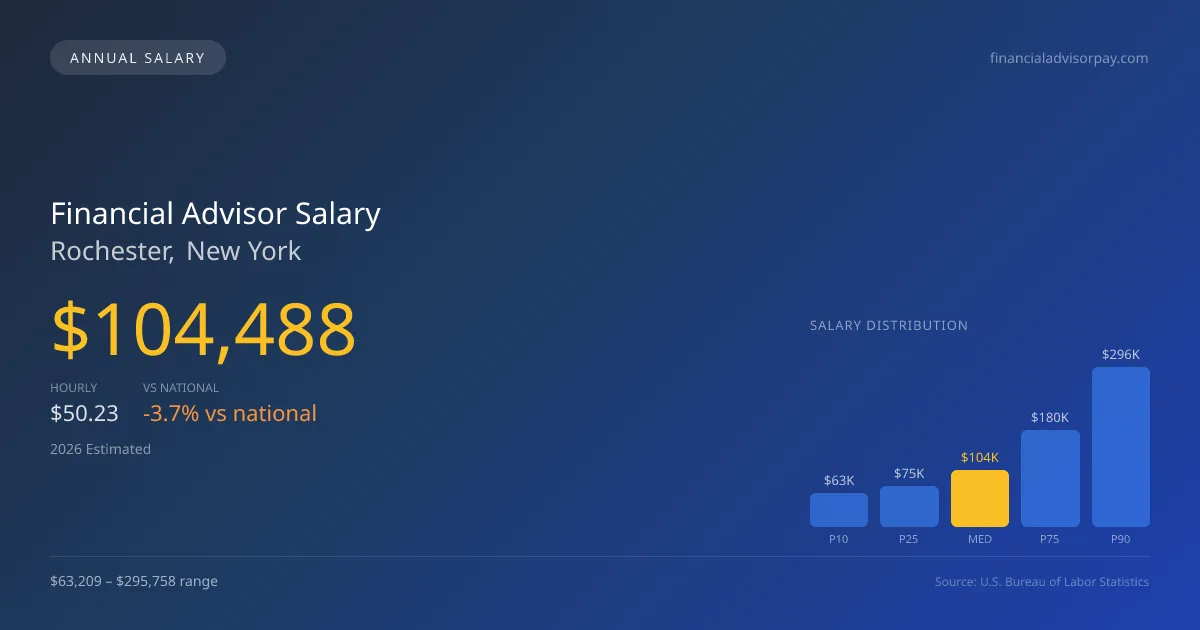
Rochester's financial advisor salary in 2026 is projected at $104,488, slightly below the national median of $108,537. The salary range for this profession exhibits significant variability, starting from $63,209 at the lower tenth percentile to a remarkable $295,758 at the ninetieth percentile. These figures, derived from official BLS OEWS surveys, highlight the financial advisory sector’s diverse compensation landscape, signaling a robust opportunity for those well-credentialed, particularly Certified Financial Planners (CFP). This credential often commands a premium, as the trend shifts toward fiduciary fee-only structures, differentiating those who prioritize client advocacy from those in commission-based models.
Salary Breakdown
| Percentile | Annual | Hourly |
|---|---|---|
| Entry Level (P10) | $63,209 | $30.39 |
| Lower Range (P25) | $74,944 | $36.03 |
| Median (P50)(typical) | $104,488 | $50.23 |
| Upper Range (P75) | $180,093 | $86.59 |
| Top Earners (P90) | $295,758 | $142.19 |
Median Salary Position
3.73% below the national average
2026 Salary Percentile Distribution in Rochester
In Rochester, NY, the financial advisor salary spread from the 10th to 90th percentile is $232,549 (2026 est.). At $104,488, the local median is 3.73% below the national median of $108,537.
Salary Calculator
At 40 hours/week in Rochester: You'd be in the entry-level range
How Rochester Financial Advisor Pay Compares
Rochester median: $104,488/year (2026)
| Compared To | Median Salary | Rochester Pays |
|---|---|---|
| New York Average | $127,424 | -18.00% less |
| National Average | $108,537 | -3.73% less |
Financial Advisors in Rochester, NY earn a median of $104,488 per year (2026 est.), which is 3.73% lower than the national median of $108,537 and 18.00% below the New York state average of $127,424.
Cost-of-Living Adjusted Salary
Rochester has a cost of living 2.97% below the national average, meaning your salary goes further here.
Adjusted salary = nominal × (100 / CoL index). CoL index: 100 = national average.
Rochester, NY has a cost-of-living index of 97.035 (below the national average of 100). A financial advisor earning $104,488 nominally has purchasing power equivalent to $107,681 in an average-cost city — an effective 3.06% boost.
Compare Purchasing Power
Select a city to see how your salary compares after cost of living
Select a city above to compare purchasing power
2019 BLS Actual
$91,670
2025 BLS Actual
$101,150
2026 Current Est.
$104,488
2019–2027 Growth
+17.7%
Salary Trajectory for Financial Advisors in Rochester (2019–2027)
2019–2025: actual BLS OEWS data for this metro area. 2026+: CAGR 3.30% projection.
| Year | Annual Salary | Status |
|---|---|---|
| 2019 | $91,670 | Actual |
| 2020 | $93,200 | Actual |
| 2021 | $81,360 | Actual |
| 2022 | $99,000 | Actual |
| 2023 | $97,660 | Actual |
| 2024 | $105,910 | Actual |
| 2025 | $101,150 | Actual |
| 2026(current) | $104,488 | Estimated |
| 2027 | $107,936 | Projected |
Based on 7 years of BLS OEWS data for the Rochester metropolitan area, the median financial advisor salary grew 10.3% from $91,670 (2019) to $101,150 (2025). At a 3.30% compound annual growth rate, salaries are projected to reach $107,936 by 2027 — a total increase of $16,266 (17.74%) from 2019.
Note: Historical values (2019–2025) are actual BLS OEWS figures for the Rochester metropolitan area, sourced from annual Occupational Employment and Wage Statistics surveys. 2026–2026 figures are current estimates, and 2027 values are projections, calculated using a 3.30% CAGR derived from 7-year BLS historical data. Actual salaries may vary based on employer, experience, certifications, and local market conditions.
Salary by Experience Level
| Experience | Estimated Salary Range |
|---|---|
| 0-2 years (New Graduate) | $63,209 – $74,944 |
| 3-5 years (Mid Career) | $74,944 – $104,488 |
| 5+ years (Experienced) | $104,488 – $180,093 |
| 10+ years (Top Earner) | $180,093 – $295,758 |
CFP, FA salary ranges estimated from BLS percentile data. Individual financial advisor compensation varies by employer, certifications, and specialization.
Financial Advisor Job Market in Rochester
Looking at the local job market, Rochester employs around 820 financial advisors, which contributes to a competitive environment despite the median annual salary. With a cost-of-living index at 97.035, financial advisors in Rochester enjoy relatively good purchasing power compared to national averages. Major employers, such as wirehouses like Morgan Stanley and independent broker-dealers like LPL and Raymond James, can offer lucrative compensation packages, particularly for those handling higher assets under management (AUM). Factors driving salary variations include the size of AUM books, the prevailing fee models, and whether advisors cater to high-net-worth client bases. To maximize pay in this market, potential advisors should consider affiliations with RIAs that emphasize fiduciary practices or explore partnerships that offer equity stakes, thereby positioning themselves for better financial outcomes in the evolving landscape of wealth management.
More salary data for Rochester, NY:
Frequently Asked Questions
How much do financial advisors make in Rochester, NY in 2026?
Is Rochester, NY a good place to work as a financial advisor?
Can financial advisors make $100K in Rochester?
What is the cost-of-living adjusted financial advisor salary in Rochester?
How much does a financial advisor make per hour in Rochester?
Related Pages
Compare Salaries
Career Resources
Nearby Cities in New York
Written by Jordan Lee, CFP
Career Analyst
Jordan has over 10 years of experience in financial planning. They specialize in retirement planning for individuals. They work at a financial services firm in New York City.
Methodology & Data Source
Salary figures on this page are 2026 projections based on the Bureau of Labor Statistics Occupational Employment and Wage Statistics (OEWS) survey, May 2026 release. The BLS reported a median annual salary of $101,150 for financial advisorsin the Rochester metropolitan area. A 3.30% compound annual growth rate (CAGR), calculated from 6-year national BLS wage trends, was applied to project current 2026 compensation. Percentile ranges (P10–P90) represent the full salary distribution across experience levels and practice settings in this market.
Data Sources & Methodology
Source: BLS, OEWS, 7-year dataset (–). Per-city data from annual BLS metropolitan area surveys.
2026 figures are projected from 2025 BLS data using a compound annual growth rate (CAGR) of 3.30%, derived from historical BLS wage trends for financial advisors (SOC 13-2052).
Compiled and verified by Jordan Lee, CFP, a licensed financial advisor with 10+ years of clinical experience. · View source data at BLS.gov