Financial Advisor Salary in Rochester, MN: $98,424 (2026)
Quick Answer:A full-time financial advisor in Rochester, MN earns a median $98,424/year (≈ $47.32/hour) in nominal terms for 2026 — projected from BLS OEWS 2025 (SOC 13-2052). Once you factor in Rochester's price level (9% below national, BEA RPP 90.8), that paycheck buys what $108,371 would nationally. Nominal pay sits 15.7% above the Minnesota state average.
Official BLS data · View source
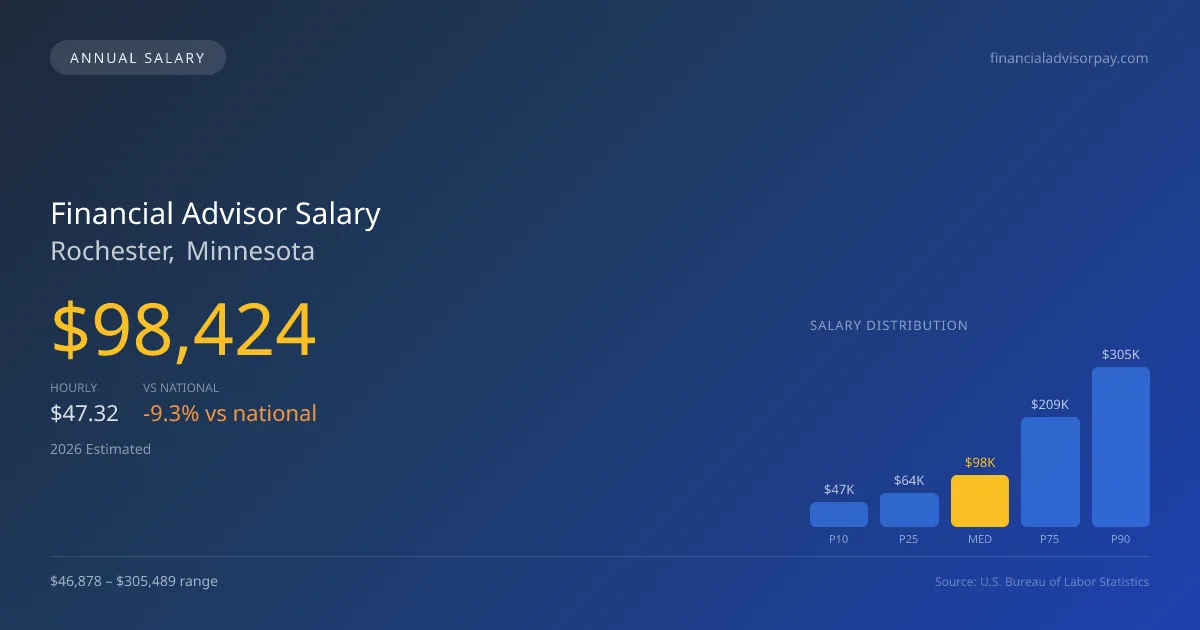
In Rochester, Minnesota, the 2026 median financial advisor salary is projected to be $98,424, which is notably below the national median of $108,537. Salary ranges for financial advisors in this region can vary widely, with entry-level positions starting at around $46,878 and top earners reaching up to $305,489. These figures come from the 2025 BLS OEWS data, projected to reflect the evolving job market in 2026. As the demand for fiduciary fee-only financial advisors continues to grow, those with the Certified Financial Planner (CFP) credential may find themselves in a stronger position to command higher salaries. The market dynamics in Rochester suggest a solid opportunity for advisors aiming to build their practices and serve a diverse clientele.
Salary Breakdown
| Percentile | Annual | Hourly |
|---|---|---|
| Entry Level (P10) | $46,878 | $22.54 |
| Lower Range (P25) | $63,963 | $30.75 |
| Median (P50)(typical) | $98,424 | $47.32 |
| Upper Range (P75) | $209,472 | $100.71 |
| Top Earners (P90) | $305,489 | $146.87 |
Median Salary Position
9.32% below the national average
2026 Salary Percentile Distribution in Rochester
In Rochester, MN, the financial advisor salary spread from the 10th to 90th percentile is $258,611 (2026 est.). At $98,424, the local median is 9.32% below the national median of $108,537.
Salary Calculator
At 40 hours/week in Rochester: You'd be in the entry-level range
How Rochester Financial Advisor Pay Compares
Rochester median: $98,424/year (2026)
| Compared To | Median Salary | Rochester Pays |
|---|---|---|
| Minnesota Average | $85,068 | +15.70% more |
| National Average | $108,537 | -9.32% less |
Financial Advisors in Rochester, MN earn a median of $98,424 per year (2026 est.), which is 9.32% lower than the national median of $108,537 and 15.70% above the Minnesota state average of $85,068.
Cost-of-Living Adjusted Salary
Rochester has a cost of living 9.18% below the national average, meaning your salary goes further here.
Adjusted salary = nominal × (100 / CoL index). CoL index: 100 = national average.
Rochester, MN has a cost-of-living index of 90.821 (below the national average of 100). A financial advisor earning $98,424 nominally has purchasing power equivalent to $108,371 in an average-cost city — an effective 10.11% boost.
Compare Purchasing Power
Select a city to see how your salary compares after cost of living
Select a city above to compare purchasing power
2019 BLS Actual
$77,860
2025 BLS Actual
$95,280
2026 Current Est.
$98,424
2019–2027 Growth
+30.6%
Salary Trajectory for Financial Advisors in Rochester (2019–2027)
2019–2025: actual BLS OEWS data for this metro area. 2026+: CAGR 3.30% projection.
| Year | Annual Salary | Status |
|---|---|---|
| 2019 | $77,860 | Actual |
| 2020 | $81,007 | Actual |
| 2021 | $77,590 | Actual |
| 2022 | $97,360 | Actual |
| 2023 | $98,840 | Actual |
| 2024 | $103,220 | Actual |
| 2025 | $95,280 | Actual |
| 2026(current) | $98,424 | Estimated |
| 2027 | $101,672 | Projected |
Based on 7 years of BLS OEWS data for the Rochester metropolitan area, the median financial advisor salary grew 22.4% from $77,860 (2019) to $95,280 (2025). At a 3.30% compound annual growth rate, salaries are projected to reach $101,672 by 2027 — a total increase of $23,812 (30.58%) from 2019.
Note: Historical values (2019–2025) are actual BLS OEWS figures for the Rochester metropolitan area, sourced from annual Occupational Employment and Wage Statistics surveys. 2026–2026 figures are current estimates, and 2027 values are projections, calculated using a 3.30% CAGR derived from 7-year BLS historical data. Actual salaries may vary based on employer, experience, certifications, and local market conditions.
Salary by Experience Level
| Experience | Estimated Salary Range |
|---|---|
| 0-2 years (New Graduate) | $46,878 – $63,963 |
| 3-5 years (Mid Career) | $63,963 – $98,424 |
| 5+ years (Experienced) | $98,424 – $209,472 |
| 10+ years (Top Earner) | $209,472 – $305,489 |
CFP, FA salary ranges estimated from BLS percentile data. Individual financial advisor compensation varies by employer, certifications, and specialization.
Financial Advisor Job Market in Rochester
The local job market in Rochester hosts approximately 110 financial advisors, indicating a competitive but supportive environment for both established and emerging professionals. With a cost-of-living index of 90.821, financial advisor pay in Rochester MN enables a relative comfort in living expenses compared to the national average, improving take-home purchasing power. Among the employers, wirehouses like Morgan Stanley and Merrill Lynch often provide attractive compensation packages, but independent RIAs, particularly those with a strong fiduciary focus, can also offer lucrative opportunities, especially if they cater to high-net-worth clients. The disparity in compensation can often be attributed to factors such as assets under management, the fee structures employed, and the credentialing of advisors. For those aiming to maximize financial advisor pay in Rochester, focusing on building a robust client base, obtaining relevant certifications like the CFP, and considering the fee-only model might prove advantageous in the evolving financial landscape.
More salary data for Rochester, MN:
Frequently Asked Questions
How much do financial advisors make in Rochester, MN in 2026?
Is Rochester, MN a good place to work as a financial advisor?
Can financial advisors make $100K in Rochester?
What is the cost-of-living adjusted financial advisor salary in Rochester?
How much does a financial advisor make per hour in Rochester?
Related Pages
Compare Salaries
Career Resources
Nearby Cities in Minnesota
Written by Jordan Lee, CFP
Career Analyst
Jordan has over 10 years of experience in financial planning. They specialize in retirement planning for individuals. They work at a financial services firm in New York City.
Methodology & Data Source
Salary figures on this page are 2026 projections based on the Bureau of Labor Statistics Occupational Employment and Wage Statistics (OEWS) survey, May 2026 release. The BLS reported a median annual salary of $95,280 for financial advisorsin the Rochester metropolitan area. A 3.30% compound annual growth rate (CAGR), calculated from 6-year national BLS wage trends, was applied to project current 2026 compensation. Percentile ranges (P10–P90) represent the full salary distribution across experience levels and practice settings in this market.
Data Sources & Methodology
Source: BLS, OEWS, 6-year dataset (–). Per-city data from annual BLS metropolitan area surveys.
2026 figures are projected from 2025 BLS data using a compound annual growth rate (CAGR) of 3.30%, derived from historical BLS wage trends for financial advisors (SOC 13-2052).
Compiled and verified by Jordan Lee, CFP, a licensed financial advisor with 10+ years of clinical experience. · View source data at BLS.gov