Financial Advisor Salary in Illinois: $117,277 (2026)
Quick Answer:Across Illinois's 64 metropolitan areas, the average median financial advisor pay sits at $117,277/year heading into 2026 — a figure projected from 2025 BLS OEWS wage data for SOC 13-2052. Because Illinois sits at BEA RPP 97.1 (3% below the U.S. baseline), that statewide median translates to roughly $120,780 in nationally-comparable purchasing power. Highest-paying metros: Springfield ($154,370), Bloomington ($141,070), Moline ($126,747).
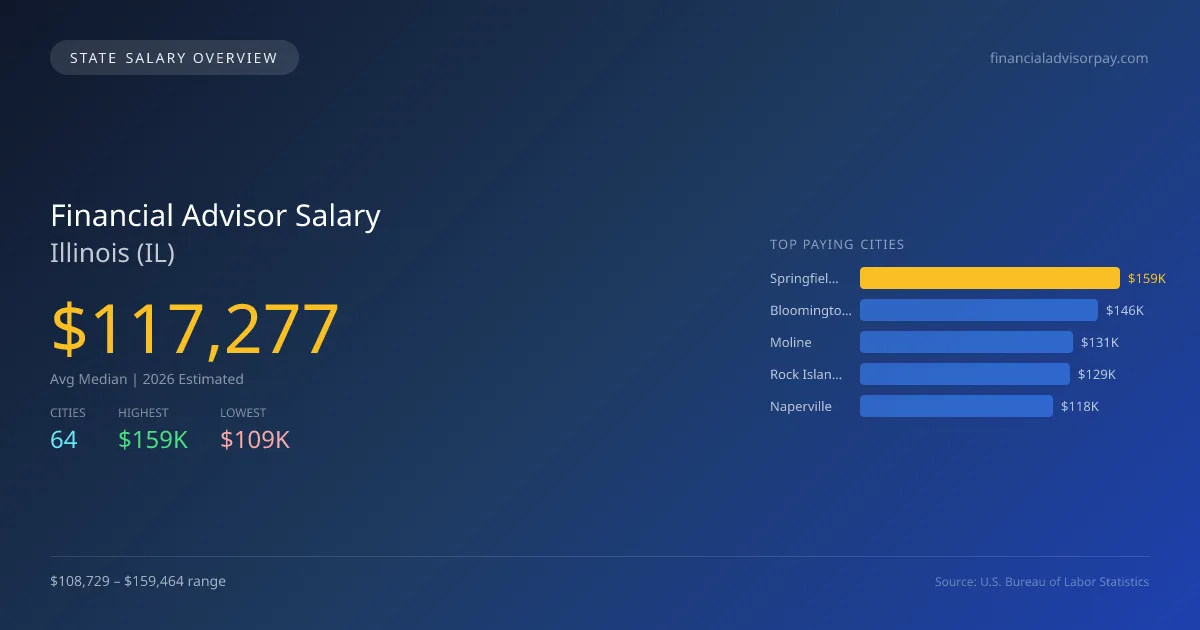
In 2026, financial advisors in Illinois are projected to earn an average median salary of $117,276, which is 8.1% higher than the national median of $108,537. The salary range varies by city, with Springfield offering the highest compensation at $159,464, while Carbondale represents the lower end at $108,729. This $50,735 salary gap is influenced by factors such as cost of living, local demand for financial services, and the concentration of affluent clients. Illinois has specific licensing requirements and scope of practice laws that financial advisors must navigate, which can impact earning potential. The demand for financial advisors is expected to grow steadily, with a projected annual growth rate of 3.30%. This is driven by factors such as an aging population seeking retirement planning and an increase in personal investment interest. Top-paying cities for financial advisors in Illinois include Bloomington at $145,725, Moline at $130,930, Rock Island at $128,902, and Naperville at $118,167. With a total of 9,524 financial advisors expected to be employed in the state, the job market presents steady opportunities aligned with national trends. Overall, Illinois provides a favorable landscape for financial advisors looking to advance their careers.
Illinois Financial Advisor Salary Range
Overall salary range in Illinois: $52,735 (lowest entry-level) to $414,873 (highest top earner)
Illinois vs National Average
Illinois financial advisors earn 8.05% more than the national median (+$8,740/year difference).
Illinois Financial Advisor Salary Distribution (2026)
Financial Advisor salaries in Illinois range from $54,087 (entry-level, 10th percentile) to $322,649 (top earners, 90th percentile), with a median of $117,277. The Illinois median is $8,740 above the US national median of $108,537. The average hourly rate is $56.39/hr. Approximately 9,524 financial advisors are employed across 64 cities.
2019 BLS Actual
$111,492
2025 BLS Actual
$113,530
2026 Current Est.
$117,277
2019–2027 Growth
+8.7%
Salary Trajectory for Financial Advisors in Illinois (2019–2027)
2019–2025: actual BLS OEWS data for this metro area. 2026+: CAGR 3.30% projection.
| Year | Annual Salary | Status |
|---|---|---|
| 2019 | $111,492 | Actual |
| 2020 | $96,663 | Actual |
| 2021 | $98,181 | Actual |
| 2022 | $82,501 | Actual |
| 2023 | $98,935 | Actual |
| 2024 | $108,019 | Actual |
| 2025 | $113,530 | Actual |
| 2026(current) | $117,277 | Estimated |
| 2027 | $121,147 | Projected |
Based on 7 years of BLS OEWS data for the Illinois metropolitan area, the median financial advisor salary grew 1.8% from $111,492 (2019) to $113,530 (2025). At a 3.30% compound annual growth rate, salaries are projected to reach $121,147 by 2027 — a total increase of $9,655 (8.66%) from 2019.
Note: Historical values (2019–2025) are actual BLS OEWS figures for the Illinois metropolitan area, sourced from annual Occupational Employment and Wage Statistics surveys. 2026–2026 figures are current estimates, and 2027 values are projections, calculated using a 3.30% CAGR derived from 7-year BLS historical data. Actual salaries may vary based on employer, experience, certifications, and local market conditions.
Top 5 Highest Paying Cities in Illinois
Lowest Paying Cities in Illinois
| City | Median Salary |
|---|---|
| Carbondale | $108,729 |
| Elmhurst | $109,813 |
| Calumet City | $110,083 |
| Galesburg | $110,119 |
| Crystal Lake | $110,542 |
Best Value Cities for Financial Advisors in Illinois
When adjusted for local cost of living, these Illinois cities offer the most purchasing power for financial advisors.
| City | Nominal Salary | CoL Index | Adjusted Salary |
|---|---|---|---|
| Springfield | $159,464 | 92.745 | $171,938 |
| Bloomington | $145,725 | 93.537 | $155,794 |
| Moline | $130,930 | 97.1 | $134,840 |
| Rock Island | $128,902 | 97.1 | $132,752 |
| Champaign | $115,221 | 92.704 | $124,289 |
Adjusted salary = nominal salary × (100 / CoL index). CoL index: 100 = national average. Lower index = lower cost of living.
Salary by Experience Level in Illinois
| Experience Level | Estimated Annual |
|---|---|
| Entry Level (0-2 years) | $54,087 |
| Mid Career (3-7 years) | $117,277 |
| Experienced (7+ years) | $322,649 |
Estimates based on BLS percentile data averaged across Illinois metro areas. Individual pay varies by employer, certifications, and specialization.
All 64 Cities in Illinois
| # | City | Median Salary |
|---|---|---|
| 1 | Springfield | $159,464 |
| 2 | Bloomington | $145,725 |
| 3 | Moline | $130,930 |
| 4 | Rock Island | $128,902 |
| 5 | Naperville | $118,167 |
| 6 | Decatur | $117,704 |
| 7 | Orland Park | $117,704 |
| 8 | Bolingbrook | $117,198 |
| 9 | Chicago | $116,946 |
| 10 | Palatine | $116,316 |
| 11 | Waukegan | $116,251 |
| 12 | Mount Prospect | $116,031 |
| 13 | Elgin | $115,903 |
| 14 | Hoffman Estates | $115,654 |
| 15 | Evanston | $115,433 |
| 16 | Joliet | $115,335 |
| 17 | Oak Park | $115,239 |
| 18 | Champaign | $115,221 |
| 19 | Danville | $115,002 |
| 20 | Urbana | $114,801 |
| 21 | Addison | $114,758 |
| 22 | Berwyn | $114,706 |
| 23 | Aurora | $114,632 |
| 24 | Tinley Park | $114,614 |
| 25 | Rockford | $114,508 |
| 26 | Northbrook | $114,497 |
| 27 | St. Charles | $114,425 |
| 28 | Gurnee | $114,398 |
| 29 | Arlington Heights | $114,237 |
| 30 | Wheaton | $114,091 |
| 31 | Woodridge | $114,056 |
| 32 | Schaumburg | $113,999 |
| 33 | Buffalo Grove | $113,966 |
| 34 | Bartlett | $113,956 |
| 35 | Lake in the Hills | $113,533 |
| 36 | Collinsville | $113,515 |
| 37 | Skokie | $113,483 |
| 38 | Wheeling | $113,317 |
| 39 | Carpentersville | $113,191 |
| 40 | Oak Lawn | $113,116 |
| 41 | O'Fallon | $113,092 |
| 42 | Quincy | $112,651 |
| 43 | Algonquin | $112,651 |
| 44 | Carol Stream | $112,552 |
| 45 | Normal | $112,546 |
| 46 | Peoria | $112,525 |
| 47 | Lombard | $112,479 |
| 48 | Cicero | $112,363 |
| 49 | Plainfield | $112,245 |
| 50 | Des Plaines | $112,224 |
| 51 | Oswego | $111,794 |
| 52 | DeKalb | $111,704 |
| 53 | Park Ridge | $111,615 |
| 54 | Hanover Park | $111,569 |
| 55 | Glenview | $111,561 |
| 56 | Romeoville | $111,111 |
| 57 | Streamwood | $110,957 |
| 58 | Downers Grove | $110,750 |
| 59 | Belleville | $110,723 |
| 60 | Crystal Lake | $110,542 |
| 61 | Galesburg | $110,119 |
| 62 | Calumet City | $110,083 |
| 63 | Elmhurst | $109,813 |
| 64 | Carbondale | $108,729 |
More Illinois Salary Data
Hourly Rates
Explore financial advisor hourly pay in Illinois cities.
Senior / Experienced
Top earner salaries for experienced financial advisors.
Compare Cities in Illinois
View all comparisons →Explore More Financial Advisor Salary Data
Frequently Asked Questions
How much do financial advisors make in Illinois in 2026?
What is the highest paying city for financial advisors in Illinois?
How does Illinois financial advisor pay compare to the national average?
What is the entry-level financial advisor salary in Illinois?
How many financial advisors are employed in Illinois?
Which Illinois city offers the best value for financial advisors?
Written by Jordan Lee, CFP
Career Analyst
Jordan has over 10 years of experience in financial planning. They specialize in retirement planning for individuals. They work at a financial services firm in New York City.
Methodology & Data Source
Statewide salary figures on this page are 2026 projections based on the Bureau of Labor Statistics Occupational Employment and Wage Statistics (OEWS) survey, May 2026 release. A 3.30% compound annual growth rate (CAGR), derived from 6-year national BLS wage trends, was applied to each metro area's reported salary to estimate current 2026 financial advisor compensation across Illinois. State averages are employment-weighted across 64 metro areas — larger metro areas with more financial advisorscontribute proportionally more to the average, producing figures that better reflect typical compensation. Individual pay varies by city, employer, certifications, and experience.
Data Sources & Methodology
Source: BLS, OEWS, 7-year dataset (–). Per-city data from annual BLS metropolitan area surveys.
2026 figures are projected from 2025 BLS data using a compound annual growth rate (CAGR) of 3.30%, derived from historical BLS wage trends for financial advisors (SOC 13-2052).
Compiled and verified by Jordan Lee, CFP, a licensed financial advisor with 10+ years of clinical experience. · View source data at BLS.gov